

Five SQL words that make PostgreSQL work harder than it needs to
A benchmark published on Planet PostgreSQL measures, line by line, the real cost of UNION, MATERIALIZED, ORDER BY random(), SELECT * and functions in WHERE without an index.

Most slow queries a DBA runs into day to day are nothing sophisticated. They do extra work that nobody asked for, because one word in the SQL told PostgreSQL to do exactly that. That is the thesis of a post published on October 9, 2026 on Planet PostgreSQL, which isolated five common keywords and measured each one against the version without it, on the same table.
The test environment was deliberately modest: a table u with 2 million rows (a bigint key, email, status, timestamptz and an md5 note), running on PostgreSQL 18.6 with default settings (work_mem of 4MB, shared_buffers of 128MB, up to two parallel workers per query), on a 2020 13-inch MacBook Pro with an Intel i5-8257U and 8GB of RAM. Each time is the execution time captured via EXPLAIN (ANALYZE, TIMING OFF), with a warm cache, discarding the first run and using the median of the rest. No network involved: EXPLAIN ANALYZE does not send rows to the client, so every measured difference is page I/O and CPU processing on the server.
UNION without ALL: the 20-fold difference
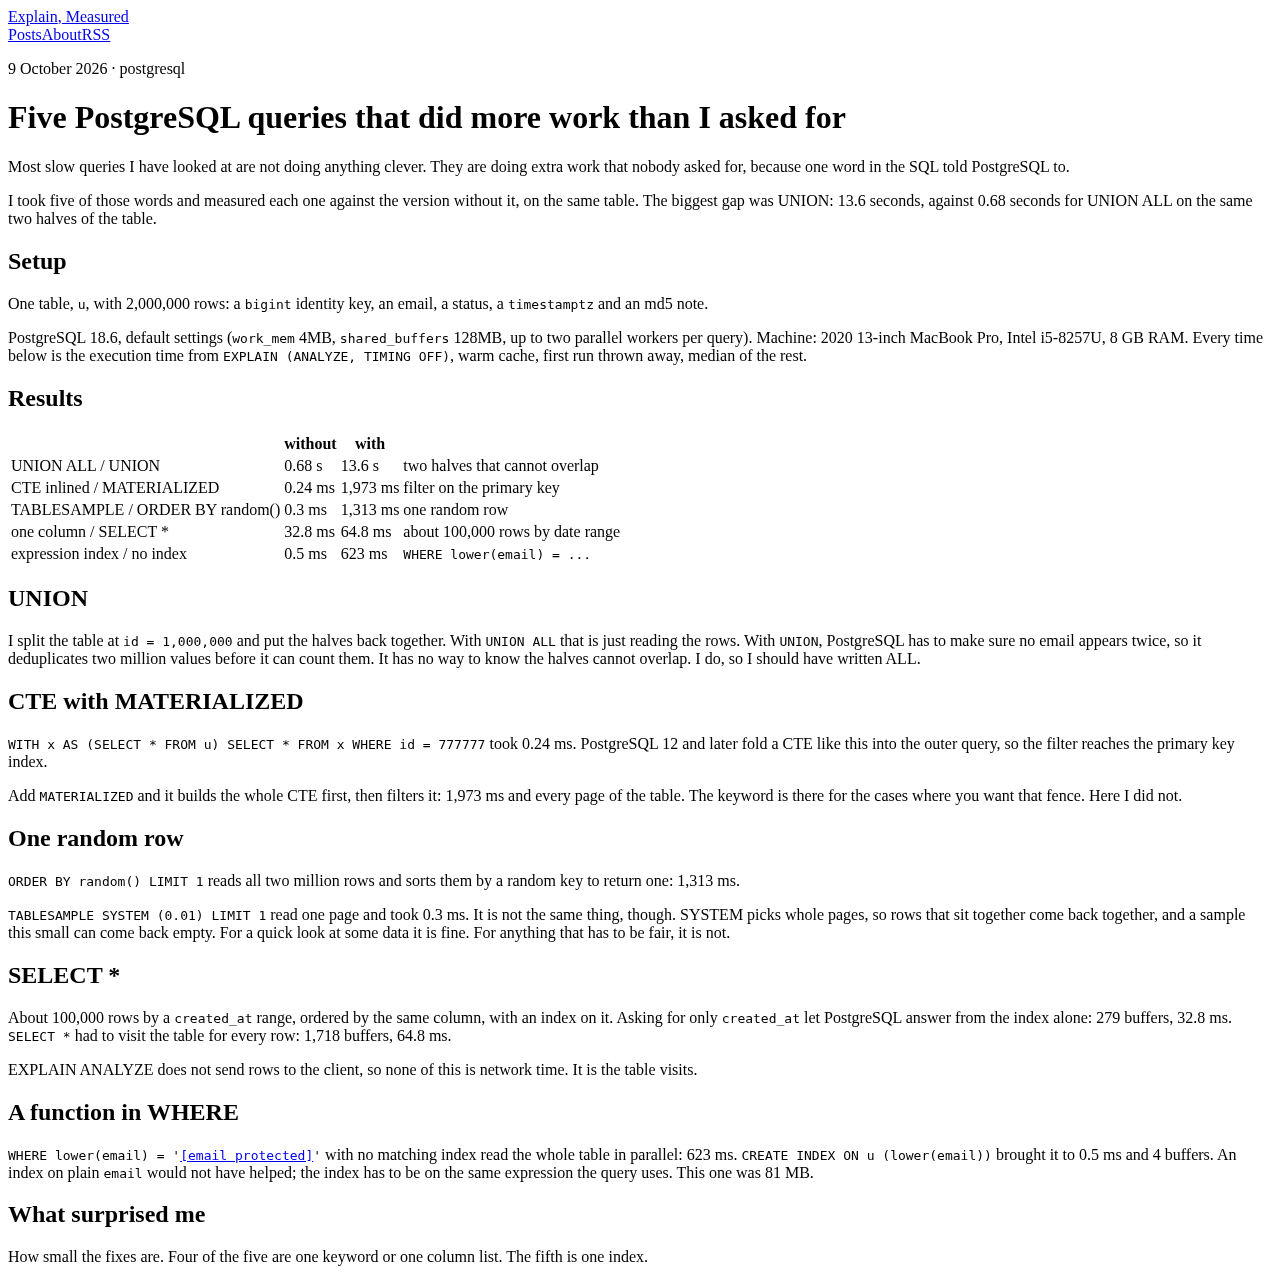
The most striking case in the benchmark. The author split the table into two halves (id < 1000000 and the rest) and brought them back together with UNION ALL and with UNION. With UNION ALL, PostgreSQL simply reads the rows from both halves and concatenates them: 0.68 seconds. With UNION, it has to guarantee that no email appears duplicated between the two halves, which forces a deduplication of 2 million values before any counting: 13.6 seconds.
The central point is that the optimizer has no way of knowing, from the SQL alone, that the two halves are mutually exclusive. The one who knows that is whoever wrote the query. In this case, according to the author, the correct choice was always UNION ALL; plain UNION is only justified when duplicates are actually possible and undesirable in the final result. In systems that compose reports or views from multiple sources, this is probably the cheapest performance fix there is: swapping one word without touching an index or a schema.
CTE with MATERIALIZED: the fence nobody asked for
Starting with PostgreSQL 12, a simple CTE like the one in the block below is inlined by the planner, meaning it gets folded into the outer query as if it were a regular subquery:
WITH x AS (SELECT * FROM u)
SELECT * FROM x WHERE id = 777777;
This lets the id = 777777 filter reach the primary key index, and execution takes 0.24 milliseconds. Adding MATERIALIZED after the AS changes the behavior completely: PostgreSQL materializes the entire CTE before applying any filter, scanning the whole table. Result: 1,973 milliseconds, more than eight thousand times slower for the same result.
MATERIALIZED exists for cases where that barrier is desirable, such as isolating the side effects of a volatile function or preventing a costly CTE from being re-evaluated multiple times within the same query. The mistake, the author writes, is using the keyword out of habit (as was done before version 12, when every CTE was an optimization fence by default) in situations where the subsequent filter should simply pass through to the index.
One random row: ORDER BY random() versus TABLESAMPLE
Grabbing some random row from the table is a common requirement, and ORDER BY random() LIMIT 1 is the most intuitive way to write it. The problem is that PostgreSQL has to read all 2 million rows, assign a random key to each one, and sort everything only to discard almost all of the result: 1,313 milliseconds in the test.
TABLESAMPLE SYSTEM (0.01) LIMIT 1 solves the same problem by reading just one page: 0.3 milliseconds. The important caveat, and the author is explicit about this, is that they are not equivalent. SYSTEM samples whole pages, so physically nearby rows tend to come back together, and a sample this small can come back empty. For a quick look at the data, the difference does not matter. For any use that requires fair, statistically valid randomness, it does matter, and the author himself acknowledges he did not test TABLESAMPLE BERNOULLI (which samples row by row, still reading every page anyway) for lack of time in this round.
SELECT * versus the column list
In a query over a created_at range bringing back about 100,000 rows, with an index on that column and ordering by the same column, asking for just created_at let PostgreSQL answer entirely from the index: 279 buffers, 32.8 milliseconds. Asking for SELECT * forced the planner to visit the heap table for every row returned: 1,718 buffers, 64.8 milliseconds, double the time and more than six times the pages read.
The explanation is the index-only scan concept: when every requested column is present in the index, PostgreSQL skips the trip to the table (provided the visibility map is up to date). SELECT * rules that out by definition, because it always requires columns that are not in the index. It is not a network problem, as the author is careful to stress: it is purely the cost of fetching extra pages from disk or cache.
A function in WHERE without an expression index
The last case is the most familiar one for anyone who has debugged a query that "should be fast": WHERE lower(email) = '...' with no matching index forces a full table scan, even if run in parallel: 623 milliseconds. Creating CREATE INDEX ON u (lower(email)) brought that down to 0.5 milliseconds, reading only 4 buffers.
The detail the benchmark makes explicit is that a plain index on email would not have helped at all here. The index has to be built on the same expression used in the WHERE clause, not on the raw column. The resulting expression index took up 81 MB in the test, a reminder that this kind of optimization carries a storage cost and a maintenance cost on every write, and should be decided by looking at the application's actual query pattern.
What the benchmark does not cover
The author himself lists the limitations, and they matter for anyone extrapolating these numbers:
- A larger
work_memwould reduce theUNIONgap, since deduplication would happen in memory instead of spilling to disk; - The entire test ran with the table cached by the operating system; tables larger than the available RAM tend to widen, not narrow, these differences;
- The numbers come from a single modest machine; what should hold on other hardware is the ratio between the two versions of each query, not the absolute seconds.
Why this matters day to day
In short: none of the five fixes requires a schema redesign or an application rewrite. Four of them are a single word or a column list; the fifth is an expression index. What makes them dangerous is precisely the lack of any symptom in a development environment: on a table of a few thousand rows, all five variants finish in a few milliseconds, and the gap only shows up once the table grows to production scale.
For anyone building and maintaining applications on PostgreSQL, the practical lesson is to look at the execution plan before scaling up hardware or adding a replica. EXPLAIN (ANALYZE, BUFFERS) on a query that looks simple will often expose, in a single line, whether the database is doing exactly the work asked for or something extra that nobody asked for. The author published the reproduction script and the raw numbers alongside the original post, and notes that the same tool will measure the next two posts in the series, which suggests more cases like these are coming.
Source 1: Planet PostgreSQL (https://postgr.es/p/9xp)
Five PostgreSQL queries that did more work than I asked for | Explain, Measured
9 October 2026 · postgresql
Five PostgreSQL queries that did more work than I asked for
Most slow queries I have looked at are not doing anything clever. They are doing extra work that nobody asked for, because one word in the SQL told PostgreSQL to.
I took five of those words and measured each one against the version without it, on the same table. The biggest gap was UNION: 13.6 seconds, against 0.68 seconds for UNION ALL on the same two halves of the table.
Setup
One table, u , with 2,000,000 rows: a bigint identity key, an email, a status, a timestamptz and an md5 note.
PostgreSQL 18.6, default settings ( work_mem 4MB, shared_buffers 128MB, up to two parallel workers per query). Machine: 2020 13-inch MacBook Pro, Intel i5-8257U, 8 GB RAM. Every time below is the execution time from EXPLAIN (ANALYZE, TIMING OFF) , warm cache, first run thrown away, median of the rest.
Results
without with
UNION ALL / UNION 0.68 s 13.6 s two halves that cannot overlap
CTE inlined / MATERIALIZED 0.24 ms 1,973 ms filter on the primary key
TABLESAMPLE / ORDER BY random() 0.3 ms 1,313 ms one random row
one column / SELECT * 32.8 ms 64.8 ms about 100,000 rows by date range
expression index / no index 0.5 ms 623 ms WHERE lower(email) = ...
UNION
I split the table at id = 1,000,000 and put the halves back together. With UNION ALL that is just reading the rows. With UNION , PostgreSQL has to make sure no email appears twice, so it deduplicates two million values before it can count them. It has no way to know the halves cannot overlap. I do, so I should have written ALL.
CTE with MATERIALIZED
WITH x AS (SELECT FROM u) SELECT FROM x WHERE id = 777777 took 0.24 ms. PostgreSQL 12 and later fold a CTE like this into the outer query, so the filter reaches the primary key index.
Add MATERIALIZED and it builds the whole CTE first, then filters it: 1,973 ms and every page of the table. The keyword is there for the cases where you want that fence. Here I did not.
One random row
ORDER BY random() LIMIT 1 reads all two million rows and sorts them by a random key to return one: 1,313 ms.
TABLESAMPLE SYSTEM (0.01) LIMIT 1 read one page and took 0.3 ms. It is not the same thing, though. SYSTEM picks whole pages, so rows that sit together come back together, and a sample this small can come back empty. For a quick look at some data it is fine. For anything that has to be fair, it is not.
SELECT *
About 100,000 rows by a created_at range, ordered by the same column, with an index on it. Asking for only created_at let PostgreSQL answer from the index alone: 279 buffers, 32.8 ms. SELECT * had to visit the table for every row: 1,718 buffers, 64.8 ms.
EXPLAIN ANALYZE does not send rows to the client, so none of this is network time. It is the table visits.
A function in WHERE
WHERE lower(email) = ' [email protected] ' with no matching index read the whole table in parallel: 623 ms. CREATE INDEX ON u (lower(email)) brought it to 0.5 ms and 4 buffers. An index on plain email would not have helped; the index has to be on the same expression the query uses. This one was 81 MB.
What surprised me
How small the fixes are. Four of the five are one keyword or one column list. The fifth is one index.
And how forgiving the slow versions look in development. On a table of a few thousand rows every one of these finishes in a few milliseconds, and the difference only appears when the table grows.
What I did not test
Larger work_mem . UNION would have deduplicated in memory with more of it, and the gap would be smaller. Tables bigger than RAM. Everything here was in the OS cache. Fair random sampling. TABLESAMPLE BERNOULLI samples rows rather than pages, which means reading every page; I did not time it. Other hardware. Compare the ratios, not the seconds.
Reproduce it
The script and the raw numbers: run2.py , results2.json . The same script also measures the next two posts in this series.
Translated from the Brazilian Portuguese original · Read the original
PostgreSQL treats kill -9 on one connection as if it were a full crash
A post published on October 9, 2026 by Shridhar Khanal explains why a signal sent to a single PostgreSQL child process brings down every connection and triggers WAL recovery, even though no one restarts the service.

