
PgBouncer: adjusting server_lifetime cuts PostgreSQL memory usage in half
A case published by Dinesh Kumar, of Cortex Ridge, shows how a multi-tenant database with 82,000 tables was filling up PostgreSQL's memory because the pooler kept connections open for 24 hours. The fix was to change a single PgBouncer setting.


- Reading
- 5 min
- Code
- 2
A case published by Dinesh Kumar, of Cortex Ridge, shows how a multi-tenant database with 82,000 tables was filling up PostgreSQL's memory because the pooler kept connections open for 24 hours. The fix was to change a single PgBouncer setting.
The temptation, faced with a memory alert, is always the same: scale up the server. It was the opposite path that solved the problem described by Dinesh Kumar, from the consultancy Cortex Ridge, in a post published on November 15, 2026 and republished on the Planet PostgreSQL aggregator. The client was receiving memory alerts at 93%, 92%, and 91% in a single day, and the fix was not to buy more RAM: it was to cut the instance's memory in half and change a single configuration setting of the connection pooler.
The problem originated in the multi-tenant architecture
The database in question uses the schema-per-tenant pattern: each end customer has its own schema within the same PostgreSQL instance. At the scale described by Cortex Ridge, that means 432 schemas and 82,058 tables in a single database. It's a legitimate modeling choice for isolating data between tenants, but it has a consequence that goes unnoticed until the database grows: every connection that moves between tenants ends up touching thousands of different tables throughout the day.
In an ordinary database, with a few hundred tables, nobody notices this effect. It's the volume here that exposes an internal PostgreSQL behavior that normally stays invisible.
The catalog cache is per connection, and PostgreSQL never empties it
Every PostgreSQL backend keeps, in its own process memory, a private cache of the tables, columns, indexes, and constraints it has already queried. This catalog cache exists to avoid constantly re-querying the data dictionary, and that's correct from a query performance standpoint: without it, every SELECT would pay the cost of re-reading system metadata.
The detail that Cortex Ridge highlights, and that every DBA should have internalized, is that this cache is not released automatically. It's only discarded when the connection closes. In an ordinary application connection, which serves few schemas during its lifetime, this never becomes a problem. In a pooler connection serving dozens of tenants per day, the cache grows without limit for as long as the connection exists.
The diagnosis: the pooler was holding connections open for 24 hours
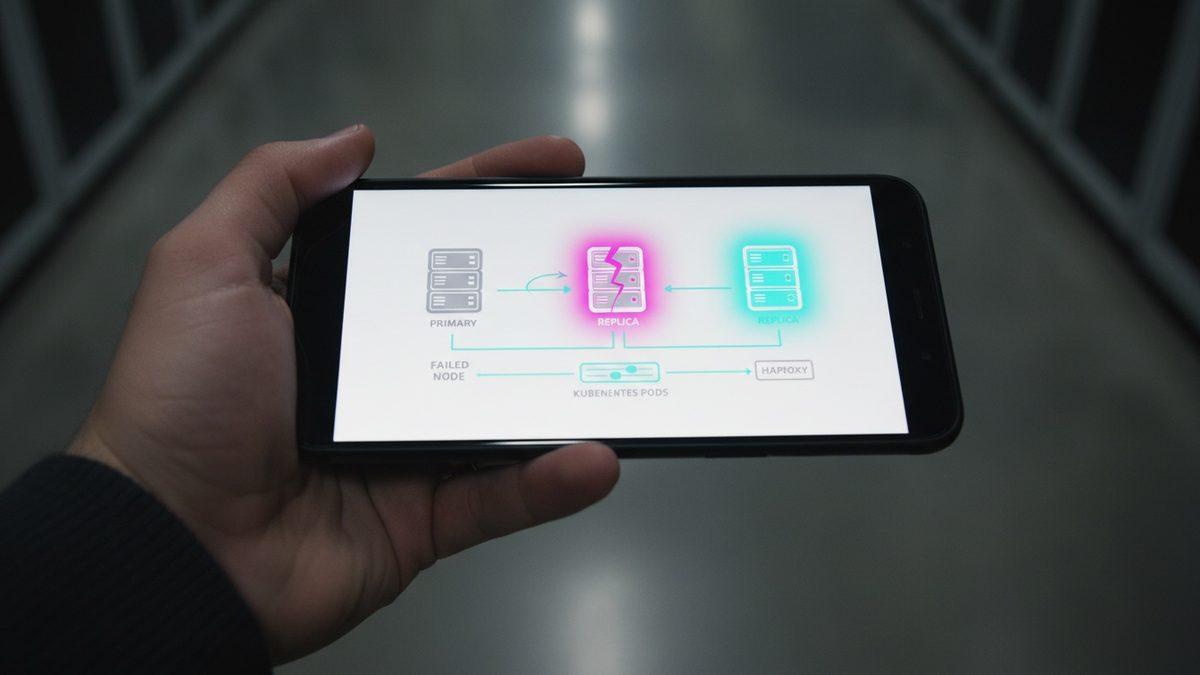
The client's applications didn't connect directly to PostgreSQL: they went through a connection pooler, which keeps a set of connections open to the database and shares them among clients. This is the recommended architecture for any PostgreSQL deployment with many concurrent connections, because opening and closing a connection to Postgres has CPU and handshake costs.
The problem was the lifetime setting for those connections: the pooler kept them open for 24 hours. Each connection in the pool accumulated, over the course of the day, the catalog cache of hundreds or thousands of different tables, and the pool as a whole ended up consuming most of the memory available on the server.
The fix: shortening server_lifetime
The change was to reduce the lifetime of each connection in the pooler to 10 minutes. In PgBouncer, the pooler referenced in this case, that parameter is server_lifetime, configured in seconds:
[pgbouncer]
server_lifetime = 600 ; 10 minutes (PgBouncer's default is 3600, one hour)
It's worth noting that the 24-hour value the client was using was already a large deviation from PgBouncer's own default, which is one hour. When a connection reaches that age limit, the pooler closes it and opens a new one as soon as it's needed. The new connection starts with an empty catalog cache, and the cost is a reconnect every 10 minutes per pool connection, overhead that in practice is invisible to the application's users.
There's an important restriction that Cortex Ridge mentions and that can't be ignored: PgBouncer only recycles a connection when no client is using it at that instant. This works well in transaction pooling mode, where the connection is freed between one transaction and the next. In session pooling mode, where the connection stays tied to the client for the duration of the entire session, server_lifetime has much less chance of kicking in, because the connection is rarely idle.
How to measure the catalog cache in your own session
For anyone who wants to verify this behavior before touching production, PostgreSQL exposes the pg_backend_memory_contexts view, available from version 14 onward, which requires superuser privileges or a role with pg_read_all_stats:
SELECT pg_size_pretty(total_bytes) AS catalog_cache
FROM pg_backend_memory_contexts
WHERE name = 'CacheMemoryContext';
The test reported by Cortex Ridge, run on PostgreSQL 18, shows the scale of the effect: running that query in a fresh session, querying around a thousand small tables, and running it again made the cache context jump from 512 KB to about 8 MB in a single connection. The authors note that wider tables, with more indexes, consume more, and that the query leaves out some related cache contexts, so the real number tends to be higher.
Multiplying that growth by the size of the connection pool, kept open for 24 hours instead of minutes, explains why the entire server was under memory pressure.
The result, and what remains open
With server_lifetime reduced, Cortex Ridge's client stopped receiving memory alerts, and the company reports having managed to cut the PostgreSQL instance's memory in half, which translated into a proportional cut in cloud infrastructure cost. The post doesn't detail the exact memory figures before and after, although the caption on the alert image published by Cortex Ridge itself identifies the cloud provider used as DigitalOcean; it's worth treating the reported gain as the result of one specific case, not as an automatic promise for every database.
This fix only makes sense for anyone with the specific combination described here: many schemas or tables per database, a long-lived connection pooler, and a pooling mode that allows idle connections to be recycled. A database with a few hundred tables and a pool in session mode probably won't notice any difference from touching this parameter, and it's worth investigating the execution plan and indexes before any infrastructure adjustment, because memory under pressure can also be a symptom of a poorly indexed query, not just catalog cache.
Cortex Ridge also documented, in another post referenced in the same article, how to resolve disk spills using ALTER FUNCTION ... SET work_mem on a per-function basis, another memory tweak worth reading for anyone running PostgreSQL in production with multiple concurrent workloads.
Translated from the Brazilian Portuguese original · Read the original

PostgreSQL Fixes 52 CVEs in a Single Minor Update and Raises the Urgency Bar for Production
The update package released on November 12 for PostgreSQL versions 18.7 through 14.25 closes 52 CVEs and more than 140 bugs, including flaws that corrupt indexes and backups. Anyone running PostgreSQL in production has work to do beyond swapping the binary.