

PMM 3.7 brings Real-Time Analytics to track live operations in MongoDB
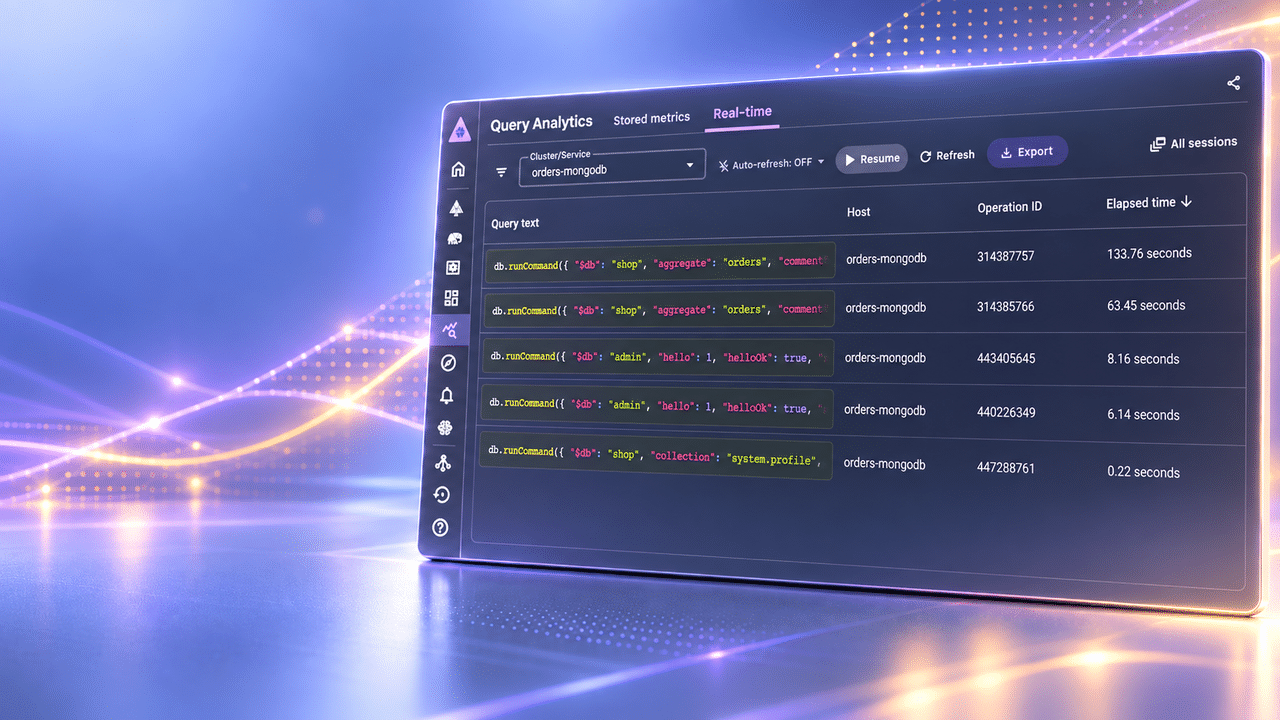
The Real-Time Analytics feature, available since version 3.7.0 of Percona Monitoring and Management, shows MongoDB operations in progress every two seconds, without having to manually run `db.currentOp()` during an incident.

The problem: db.currentOp() in a loop
Every DBA knows the scene. The application slows down, the team's channel lights up, and someone asks the usual question: what's running on the database right now? The Query Analytics (QAN) feature of Percona Monitoring and Management (PMM) handles the historical half of that question well, showing which queries consumed the most time in the last hour or the last 12 hours.
The problem is that QAN only works with operations that have already finished. MongoDB only logs an operation in the profiler or diagnostic log once it completes, so an aggregation that has been running for two minutes and hasn't finished yet simply doesn't show up there. Until PMM version 3.7.0, the manual workaround for this gap was to open mongosh, run db.currentOp(), scroll through a giant JSON, and repeat the process every few seconds to see whether the operation was still alive.
Tibor Korocz, an engineer at Percona, described this ritual in a post published on October 6, 2026 on the company's blog, and it's from there that it's worth understanding the feature that arrived to replace that routine: Real-Time Query Analytics, or RTA.
QAN shows the past, RTA shows the present
In a sentence: RTA displays every MongoDB operation that is running at this exact moment, updating the list every two seconds (a configurable interval), and forgets each operation as soon as it finishes. After that, if the operation generated relevant load, it shows up in QAN normally, as it always has.
The two features are complementary, not competing:
| Query Analytics (QAN) | Real-Time Analytics (RTA) | |
|---|---|---|
| What it shows | Finished queries, grouped by fingerprint | Operations running now, one row per operation |
| MongoDB source | Profiler or slow query log | $currentOp, every 2 seconds |
| Storage | ClickHouse, with retention | In-memory only |
| Answers | "What was slow last night?" | "What's slow right now?" |
Under the hood, a new agent inside pmm-agent, called rta-mongodb-agent, runs the $currentOp aggregation on the admin database every two seconds. The result goes to the PMM Server and lives only in memory: nothing is written to ClickHouse, and an old snapshot is discarded after 30 seconds. For now, RTA works only with MongoDB; support for MySQL and PostgreSQL is planned, with no release date announced.
How to enable the feature
The good news is there's nothing extra to install. If PMM is already monitoring your MongoDB, RTA reuses the same connection and the same credentials as the MongoDB exporter. The prerequisites are:
- PMM Server and PMM Client version 3.7.0 or later. Korocz's recommendation is to go straight to 3.9.0 or later, since that's the version where CSV export arrived.
- The MongoDB user that PMM already uses needs the
inprogprivilege to run$currentOpwithallUsers: true; this privilege already comes with theclusterMonitorrole, which is the one recommended in PMM's official documentation. - Admin role in PMM to start or stop a session. Users with the Viewer role can only follow sessions that are already underway.
With that in hand, the path is:
- Open Query Analytics and go to the Real-time tab.
- Choose a cluster or a service in the Cluster/Service field (choosing the cluster selects all of its services).
- Click Start session.
PMM creates an rta-mongodb-agent for the chosen service, later visible in pmm-admin list. In a replica set, you need to start a session for each member you want to observe; choosing the whole cluster does this automatically. One important detail: the session doesn't stop on its own, it runs until someone ends it on the All sessions page, and then it stops for everyone who was watching. While it exists, the agent queries MongoDB every two seconds, so it's worth ending sessions that are no longer in use. To adjust this interval (the minimum is one second):
pmm-admin inventory change agent rta-mongodb-agent <agent-id> --collect-interval=5sA practical case: the aggregation that never showed up
To demonstrate the full flow, Korocz set up a lab with Percona Server for MongoDB 8.0, a shop.orders collection with 4 million documents, and three fictitious applications connected to the same database: orders-api, checkout-service, and reporting-job. The reporting-job periodically runs a duplicate-customer check.
Once the RTA session starts, the table shows every operation in flight, updated by default every two seconds. Sorting by the elapsed-time column, two aggregations on orders appear at the top: one running for nearly two minutes, the other for 49 seconds. Also showing up are hello commands (drivers waiting for a topology change) and a read on system.profile, which is PMM's own QAN agent monitoring the database, and these can be ignored.
Clicking the longest-running row opens a details panel, and the capture pauses so the row doesn't disappear from the screen while you read it. That panel holds the complete evidence:
- Plan summary
COLLSCAN: a full scan of the 4 million documents. - Client app name
reporting-job: identifies who fired the query. - The pipeline starts with a
$lookupoforderswith itself, usingcustomer.email, a field with no index. maxTimeMS: 240000: MongoDB kills the operation after four minutes, and the job simply fires it again.
QAN would eventually show this aggregation, but only after it finished. RTA shows it while it's running, with client, execution plan, and full command; the Raw data tab brings the entire $currentOp document, locks included.
What to do (and not do) once you have the culprit
RTA has no kill-operation button, and that absence is deliberate. If it's really necessary to interrupt it, you copy the Operation ID and run the command manually:
db.killOp(314387757)Extra caution is warranted before doing this, especially if the operation is a write: killing the process only buys time, because the job will fire the same query again on the next cycle. The actual fix, in the lab's case, is to create the missing index on the field used by the $lookup:
db.orders.createIndex({ "customer.email": 1 })Since RTA doesn't store anything, anyone who needs to bring the evidence to a post-mortem the next day should click Pause and then Export. The resulting CSV carries every row that passed the applied filter, across all pages, with the raw query included, useful both for an incident report and for sharing with a colleague or with Percona support.
Limitations worth knowing before your next incident
In short: RTA is powerful, but it has clear boundaries that change how much you can rely on it during a crisis.
- It works only with MongoDB for now, and requires PMM Client 3.7.0 or later on the monitored service.
- It's a snapshot every two seconds: operations under 10ms, or ones that start and finish between two polls, never show up there, and remain QAN's job.
- Nothing is stored: when the operation finishes, it also disappears from RTA, unless someone paused and exported it first.
- The query text is reconstructed from the command document, so it may look different from what the application sent (aggregations show up as
db.runCommand(...)); the Raw data tab keeps the original. - Anyone who opens the page sees raw values, including sensitive data such as customer email addresses in Korocz's lab; that's a point of attention for production environments with real data.
- Sessions keep running until someone stops them manually, consuming query cycles on the database at each configured interval.
What changes for those running MongoDB in production
For those who maintain applications on top of MongoDB, RTA's practical gain is cutting the time between 'the database is slow' and 'I found the cause' without having to keep a mongosh session open running db.currentOp() in a manual loop. In the lab example, the entire path, from the slowness alert to identifying the indexless COLLSCAN fired by reporting-job, is described as taking less than a minute.
This doesn't eliminate the need to understand execution plans and data modeling: RTA pinpoints the symptom precisely, but the fix remains the same as always, a well-designed index on the right field. It's also worth noting the retention and raw-data-exposure limitations before granting Viewer access to larger teams, especially on databases with sensitive customer information. The feature's full documentation is published on Percona's site, along with the official PMM forum for those already running RTA in production who want to swap experiences.
Translated from the Brazilian Portuguese original · Read the original
How to consolidate multiple databases into a single Postgres with logical replication
In the second part of his series on logical replication, Dimitri Fontaine shows how to merge schemas from different applications into a single Postgres warehouse, and still republish the changes as a CDC stream.

