Atlassian rebuilds metrics pipeline with OpenTelemetry without changing the gostatsd interface
The company replaced gostatsd with an OpenTelemetry Collector pipeline to process data from about 100,000 hosts across 14 regions, keeping the same StatsD endpoint that thousands of services already used.

Atlassian published a post on the CNCF blog, signed by Iris Grace Endozo, Farzad Vazirnia and Albert Kerr, detailing how it rebuilt its metrics platform by replacing gostatsd with a pipeline based on OpenTelemetry Collector, according to reporting from InfoQ. The system receives data from approximately 100,000 hosts across 14 regions and operates under a 99.95% SLO, which made any engine swap a high-risk operation: the same data feeds production alerts.
The problem: a protocol that no longer scales
gostatsd had worked reliably for years, but its design was UDP-only and didn't support traces or logs. At the same time, more and more internal services were already generating data in the OpenTelemetry format. Continuing to bet on gostatsd would have meant rebuilding, in-house, functionality that the OpenTelemetry Collector community had already developed.
The path the team chose avoided the most obvious route: asking thousands of services to swap their StatsD client for OpenTelemetry SDKs all at once. Instead, the team kept the StatsD-over-UDP interface intact and rebuilt everything that existed behind it.
We kept the interface and rebuilt everything behind it, which turned an org-wide migration into a platform-team migration.
Iris Grace Endozo, Farzad Vazirnia and Albert Kerr, Atlassian
Four stages, one rebuild at a time
The new platform follows the OpenTelemetry Collector pipeline model, in which receivers take in data, processors transform it, and exporters send it to one or more destinations. Atlassian split the operation into four stages (collection, ingestion, aggregation, and forwarding), which made it possible to swap each part in isolation without replacing the others.
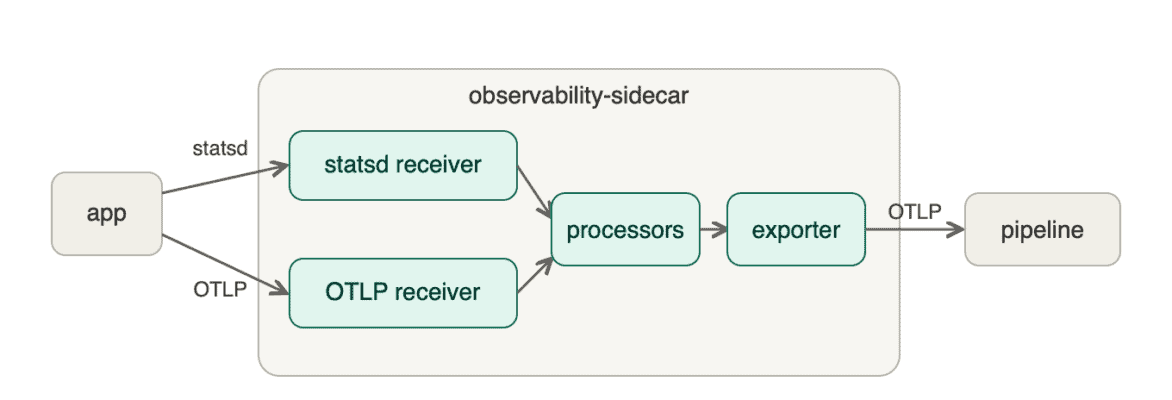
Collection. The gostatsd sidecar was replaced by the same Collector distribution already used by the tracing team. Applications kept sending StatsD packets to the same address, while an OTLP receiver started accepting OpenTelemetry metrics from newer services. Unifying metrics and traces in a single sidecar saved an average of 3.9% CPU on the platform's most expensive Micros services, and the team estimates a cut of about 30% in sidecar costs across the whole fleet. An OpenTelemetry extension for Lambda preserves the same interface on serverless workloads, where there's no way to run a sidecar.
Ingestion. Metrics aggregation is stateful: every point in a time series needs to reach the same aggregator. The old nomad proxy hashed by service and environment, concentrating the largest services on a few overloaded replicas. The new system uses the OpenTelemetry Collector Contrib load-balancing exporter to hash by stream ID, keeping each time series together while spreading a large service across the whole pool. The result, according to Atlassian, was more even CPU distribution, fewer hot shards, and better off-peak scaling.
Aggregation. This is where the biggest gain in data volume happens. The platform receives about 4.8 billion data points per minute and stores approximately 220 million, a reduction of about 96%. Since upstream OpenTelemetry components didn't aggregate delta metrics the way Atlassian needed, the company built and open-sourced its own aggregation processor. The new layer uses about half the CPU for the same traffic.
Forwarding. An in-house forwarding service was replaced by a stateless Collector distribution called metrics-gateway. Upstream exporters now distribute data to destinations like SignalFx and S3, with the Collector handling retry, queuing, and backpressure. According to the authors, adding a new destination became a configuration change instead of a separate integration project.
How the migration was carried out
Atlassian recommends starting with development and staging environments, choosing early adopters who have something to gain from the change, and then scaling the rollout in stages of 1%, 10%, 50%, and 100%. The team also advocates preserving already-familiar operational workflows while the old and new systems run in parallel, and measuring under real production load instead of relying only on small benchmarks.
Small tests and benchmarks were not enough; continuous profiling in prod is what actually told us where to optimise.
Iris Grace Endozo, Farzad Vazirnia and Albert Kerr, Atlassian
Atlassian says gostatsd aggregation and nomad still account for about 38% of the CPU requested in the metrics clusters, with nomad alone consuming about 13% of the total. Removing them will complete the end-to-end OpenTelemetry pipeline. The next planned step is migrating application instrumentation from StatsD, DogStatsD, and vendor clients to OpenTelemetry SDKs.
Atlassian, Airbnb, and Skyscanner: three different routes
Atlassian's approach differs from other recent metrics migrations to OpenTelemetry. Airbnb, in earlier InfoQ coverage, used dual emission from a shared metrics library and adopted VictoriaMetrics' vmagent for streaming aggregation, reaching more than 100 million samples processed per second. Skyscanner, in turn, standardized instrumentation and transport on OpenTelemetry from the start and migrated more than 300 microservices by updating a common library.
Atlassian chose to preserve the StatsD endpoint and move the pipeline underneath it, rather than requesting immediate reinstrumentation. In all three cases, application migration was decoupled from the replacement of the core infrastructure, but Atlassian isolated the risk even further: with thousands of internal services, reinstrumenting everything at once would have been a longer and riskier program than rebuilding the engine behind an already stable interface.
In a translated report from a conference, Iwahori, monitoring infrastructure lead at GREE, called Atlassian's approach well thought out, praising in particular the stream ID routing and the custom delta aggregation processor. Iwahori raised a practical question about how to scale a stateful aggregation layer, and Atlassian's answer indicated that this part still depends on manual configuration.
What this means for infrastructure operators in Brazil
Atlassian's case is a replicable playbook for any team that has a legacy protocol (StatsD, DogStatsD, or proprietary telemetry) spread across hundreds of services and can't stop everything to migrate. The central lesson isn't OpenTelemetry itself, but the decision to separate the public interface from the implementation: whoever depends on the endpoint doesn't need to know the engine changed.
For smaller teams in Brazil running Kubernetes or serverless with tight observability budgets, the most useful takeaway is the aggregation one: cutting data volume by 96% before storage is the kind of optimization that lowers the bill for tools like Datadog, New Relic, or in-house Prometheus-based stacks. The delta aggregation processor that Atlassian open-sourced is a concrete starting point for anyone facing the same bottleneck without the same engineering budget.
It remains an open question, as Iwahori himself pointed out, how to scale the stateful aggregation layer without depending on manual configuration, something any team considering adopting this design will run into sooner or later.
Translated from the Brazilian Portuguese original · Read the original

KiviDB claims to be up to 9 times faster than Redis while keeping full compatibility
KiviDB is an in-memory database written in Rust that speaks the Redis protocol, adds native vector search, and publishes its own benchmarks against Redis, Dragonfly, and KeyDB. The numbers show a real gain in pure caching, but the story is more contested in vector search.