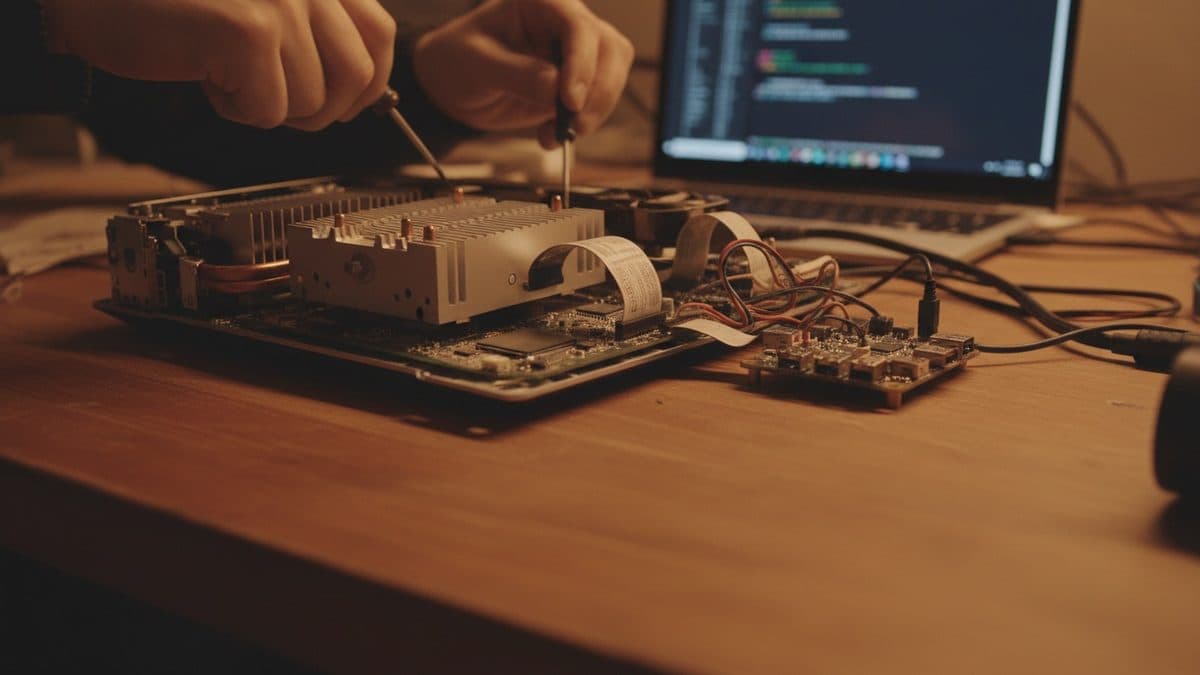

Google Adds Cycle-Level Kernel Profiling to XProf for TPUs
The open-source profiling tool for TPU workloads gained a suite that exposes cycle-by-cycle hardware counters inside Pallas kernels, previously black boxes in traces.

Google published, via a technical post from its AI Infra team, a new Kernel Profiling suite inside XProf, its open-source profiler for TPU workloads. The news, reported by InfoQ on September 23, 2026, addresses a specific problem for those writing custom TPU kernels with Pallas, Mosaic, or Triton: until now, these kernels showed up as opaque blocks in traces, with no visibility into what happened inside them cycle by cycle.
For those building heavy ML infrastructure, this matters less for the announcement itself and more for the reason behind it: TPU profiling tools have always relied on the XLA compiler's static cost models, and those models simply can't see what happens inside a kernel that bypasses the standard compilation pipeline.
Why XLA's numbers lied for custom kernels
According to Yogesh SY, of Google's AI Infra team, kernels built with Pallas, Mosaic, or Triton bypass XLA's standard passes. This distorts the static cost models used in metrics such as "optimal FLOPs" and goodput efficiency, which can simply become wrong or stop working. The example given is direct: a static tool may mark an MXU instruction block (the TPU's matmul unit) as fully utilized, when in reality the unit is idle waiting for data to arrive from HBM, because static analysis doesn't see time, only code structure.
It's the kind of problem any performance engineer knows from the GPU world (profilers like Nsight Compute exist precisely to close this gap between theory and real execution), but one that the TPU/JAX ecosystem didn't have such a granular answer for until now.
How the suite works, in three layers
The implementation exposes information at three different levels, each with its own activation mechanism.
At the compiler level, two flags enable inspection:
--xla_enable_custom_call_region_trace=true
--xla_xprof_register_llo_debug_info=true
With them enabled, XProf's Graph Viewer starts showing a "Custom Call Text" panel with the lowered MLIR of each custom call, making it possible to check whether operations are actually fused and whether memory tiles are structured as the dev intended.
At the static execution level, the Trace Viewer displays data from Low-Level Operations (LLO) bundles: machine instructions per clock cycle, in time-aligned tracks for the MXU, scalar and vector ALUs, vector fills, loads, spills, stores, and the cross-lane unit (XLU).
At the runtime telemetry level, XProf periodically samples hardware counters. By default this has a resolution floor of 1µs, dictated by a host-level timer, enough for most analyses, but not for very fast events inside a single kernel.
Sub-microsecond via external trigger
The newest part is an external-event-triggered capture mode that removes this 1µs floor. In this mode, the sampler captures TPU trace instructions and boundary triggers, such as entry and exit of custom call scopes, enabling sub-microsecond attribution, that is, knowing exactly which part of the kernel spent which fraction of time.
Configuration is done via jax.profiler.ProfileOptions, using tpu_enable_periodic_counter_sampling and tpu_tc_perf_counter_sampling_options with is_external_trigger:true. For the traditional periodic mode, the equivalent flag is interval_us. It's possible to configure up to 28 counters per core, distributed across up to four SparseCores, a 4x28 matrix of options, which forces the engineer to carefully choose which counters to track in each investigation, since the budget is limited.
The Matmul Case: 125.5µs to 88µs
InfoQ reports an internal Google case study used to demonstrate the workflow: a tiled matmul kernel (matrix multiplied in blocks) was showing a memory stall. With hardware counters active, the team saw large spikes in sync_wait events, a sign that the kernel was waiting for data from HBM instead of computing. The fix applied was triple buffering, a technique that overlaps HBM loads with MXU compute. The result: kernel time dropped from 125.5µs to 88µs, a reduction of about 30%.
The source itself gives a warning worth noting: this number comes from a single demonstration kernel written by Google, not from a broad benchmark. It shows the optimization workflow, not a promise of an equivalent gain in any Pallas kernel.
A confidence hierarchy for metrics
The post also establishes what it calls a "confidence hierarchy" for TPU performance metrics. Values read directly from hardware registers, such as HBM utilization and TPO metrics, count as ground truth for custom kernels. XLA cost model estimates need to be treated with caution when the kernel in question didn't go through the standard compilation pipeline.
A new Perf Counters View lists more than 16,000 raw counters in tabular format. A technical detail worth noting: the track height in the trace reflects the maximum raw counter value in that interval, not a normalized percentage. The source gives a calculation example: an increment of 100 cycles in a 500ns window, on a core running at approximately 2.0 GHz, equals 10% utilization of that unit. It's a calculation that anyone reading these raw charts will need to do manually.
What remains open
XProf is part of the OpenXLA project and integrates with JAX profiling, but InfoQ is explicit: Google's post doesn't define a release status or version for the Kernel Profiling suite. There is, therefore, no guarantee of API stability at this point.
Counter sampling is documented for TPU v7 (Ironwood), Google's most recent TPU generation. Teams running earlier TPU generations shouldn't assume the same counter coverage or the same behavior.
For those already working with Pallas who want to get started, the path indicated by the source is the "Pallas Matmul with Perf Counters" notebook in the XProf repository, along with OpenXLA's kernel profiling instructions.
The Take for Developers in Brazil
TPU is still niche infrastructure around here: the overwhelming majority of Brazilian teams optimizing low-level ML kernels are in the CUDA/GPU world, with tools like Nsight Compute already mature for this kind of cycle-by-cycle analysis. The direct audience for this news is smaller: teams running training or inference on TPU via Google Cloud, generally startups and research teams that use JAX as their main stack, and that write custom Pallas kernels to squeeze performance beyond what XLA delivers by default.
For this specific group, the practical message is clear: stop trusting efficiency numbers derived from XLA for custom kernels and anchor optimization in register-level counters. It's a change in work discipline, not just a new feature, and it only really applies to those on the TPU v7 generation. For those who only consume TPU via high-level APIs, without writing their own kernels, the direct impact is practically nil, but it serves as a thermometer for where Google is pushing the JAX/Pallas ecosystem: increasingly toward the fine-grained control that until now only the GPU world had in a consolidated way.
Source
Translated from the Brazilian Portuguese original · Read the original

KiviDB claims to be up to 9 times faster than Redis while keeping full compatibility
KiviDB is an in-memory database written in Rust that speaks the Redis protocol, adds native vector search, and publishes its own benchmarks against Redis, Dragonfly, and KeyDB. The numbers show a real gain in pure caching, but the story is more contested in vector search.