Grafana Tempo 3.1 swaps ID lists for TraceQL queries in trace redaction
Tempo 3.1 lets you redact entire traces with a single query, fixes metrics skewed by sampling, and strengthens the Kafka client that became a central piece of the architecture since version 3.0.

Grafana Labs released Tempo 3.1, the first minor update on top of the 3.0 architecture, published in June 2026. The central new feature is practical: it lets you redact sensitive data in traces using a TraceQL query, instead of manually enumerating every affected trace ID. The release also adds TLS and new SASL mechanisms to the Kafka client, introduces an experimental hint that fixes TraceQL metrics skewed by sampling, and makes the vParquet5 block format the default. According to Grafana, simple metrics queries now run almost twice as fast.
Why the Kafka client matters now
Since Tempo 3.0, Kafka has stopped being optional and become part of the critical path in microservices deployments, in the architecture named Project Rhythm. In this design, distributors write to a Kafka topic; block-builders consume that topic to write Parquet blocks to object storage; live-stores consume the same topic to serve recent traces. Ingesters and compactors disappear from the design, replaced by a backend scheduler and workers. Grafana states that dropping the replication factor of 3 reduces storage from 3 to 3.5 times the trace volume down to a single copy. Monolithic mode continues to not depend on Kafka.
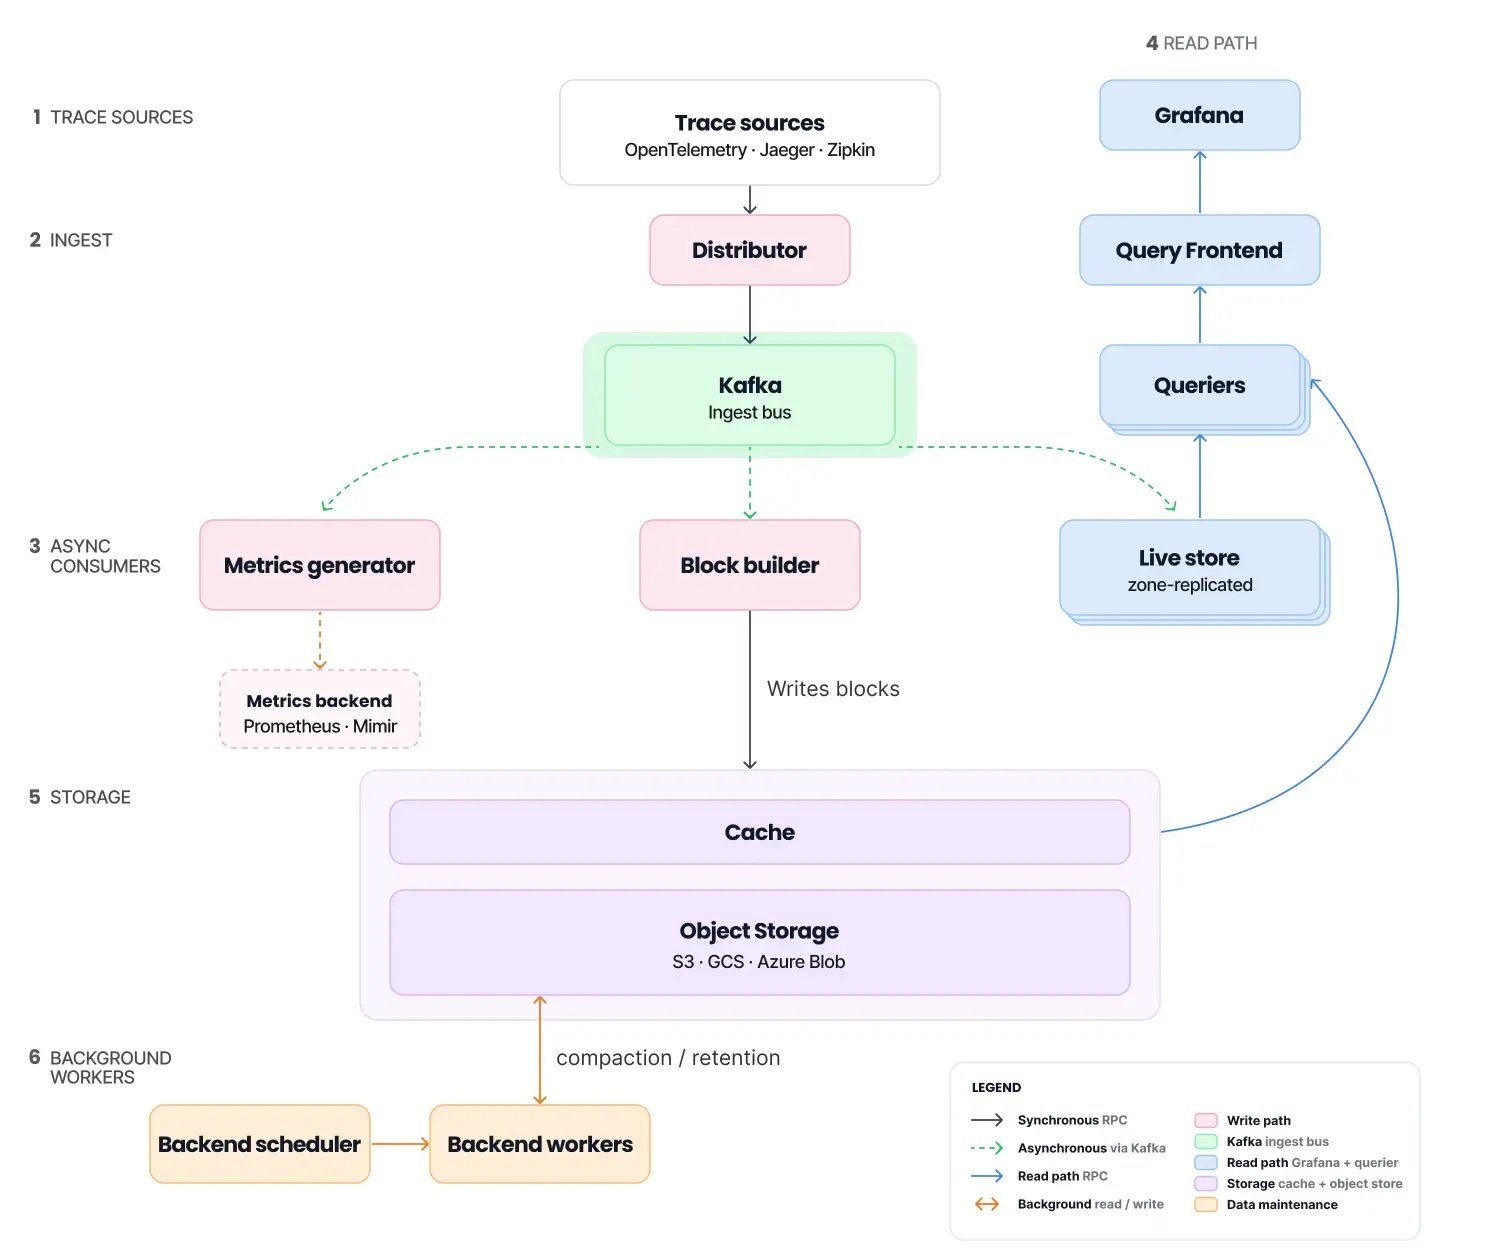
The problem is that Tempo 3.0's Kafka client only supported SASL PLAIN over an unencrypted connection, so any broker that required TLS would refuse the connection. This made it unfeasible to use Tempo with managed brokers that require security by default. Tempo 3.1 fixes this by adding:
- TLS, including optional mTLS
SCRAM-SHA-256andSCRAM-SHA-512OAUTHBEARERAWS_MSK_IAM
A new client_rack option also arrives, enabling zone-aware reads (KIP-392): block-builders, live-stores, and metrics-generators now read from a replica in their own availability zone, avoiding cross-zone transfer costs. This requires brokers with a configured rack ID. A new producer_compression option accepts none, gzip, snappy, lz4, or zstd, with snappy as the default when not specified. Grafana highlights that this option, combined with TLS, makes Azure Event Hubs viable as a backend, since the service only accepts gzip. The three changes (TLS/SASL, client_rack, and producer_compression) came from community contributors, not from Grafana Labs itself.
For teams running a Tempo cluster in production in Brazil, this removes a real barrier: corporate security teams usually block any service that talks to Kafka without TLS, and managed brokers on AWS or Azure frequently require SASL with IAM or OAuth. Before 3.1, this forced proxy workarounds or simply blocked adoption of Project Rhythm.
Trace redaction without listing IDs one by one
The redaction feature, introduced in 3.0 through the tempo-cli redact command, required manually listing the trace IDs to delete. In practice this is unfeasible when a leaked token or account number appears scattered across thousands of traces: there's no way to track and list each occurrence by hand. In 3.1, the command now accepts a TraceQL query directly, and gains the --dry-run flag, which counts matches without actually rewriting the blocks.
Grafana limited the accepted syntax for safety: only a spanset filter, using equality comparisons on resource.* and span.* attributes, combined with && and ||. The restriction exists because block rewriting cannot be undone once applied. The --start and --end flags allow restricting the time window, which matters because Tempo pauses tenant compaction while redaction is in progress.
One operational detail deserves the attention of whoever administers the cluster: older workers ignore the time-window flags and remove every match in each block they receive, without raising an error. Grafana's recommendation is to only use the new flags after the scheduler and all workers are already running 3.1; otherwise, redaction can silently delete more data than intended.
TraceQL metrics that understand sampling
TraceQL metrics, which became generally available in 3.0, get three changes in 3.1. The most relevant is the experimental with (extrapolate=true) hint, which scales the result by the sampling rate recorded in tracestate, following OpenTelemetry's probability sampling rules. At 50% sampling, each stored span now counts as two. Spans without a recorded rate still count as one, so partial adoption of probabilistic sampling in some services doesn't skew the numbers for others.
The hint applies to rate(), count_over_time(), sum_over_time(), avg_over_time(), histogram_over_time(), quantile_over_time(), and compare(), but not to min_over_time() or max_over_time(); that makes sense, since extremes don't extrapolate by proportion. The feature requires blocks in vParquet4 or higher, and reads the sampling rate the same way the metrics-generator's enable_tracestate_span_multiplier setting has since 3.0, so ad-hoc queries and pre-aggregated series should match.
The other two changes are more straightforward:
- The
+,-,*, and/operators now work between metrics queries and scalars, allowing you to calculate an error rate in a single query, without post-processing in the panel. - The span-only fetch path, experimental in 3.0, becomes the default for
vParquet5blocks. In a warmed-up test, the{ } | rate()query finished in a little over half the previous time.
For teams operating observability with aggressive sampling (common in high-volume services to control storage cost), this solves a subtle problem: metrics calculated over sampled traces always underestimate reality, and until now the correction was up to each team, manually, outside the tool.
Trace diff designed for LLMs
Tempo 3.1 also brings an experimental span-pruning feature in the trace-by-ID v2 endpoint, which collapses similar leaf spans into a single summary span carrying count and duration statistics. The same endpoint gains TraceQL filtering. A new experimental endpoint also arrives, POST /api/v2/traces/diff, which compares two traces and can return a compact summary instead of a span-by-span patch.
This diff endpoint is exposed via gcx, tempo-cli, and the Tempo MCP server, and Grafana is explicit about the reason: the smaller payload helps investigations conducted by LLMs, where every context token costs latency and money. It's a sign of the times: observability tools are starting to design endpoints with AI agents as a consumer in mind, not just dashboards for humans.
The metrics-generator also gains an unmatched_span_kind label on expired service-graph edges, support for the db.system.name attribute (renamed by OpenTelemetry), and pooled label buffers that, according to Grafana, zero out per-span allocations in its internal service-graph benchmarks.
What remains open
Query-based redaction, the sampling extrapolation hint, and trace diff are all marked experimental by Grafana itself, meaning they're subject to API changes before becoming stable. Anyone already running Project Rhythm in production also needs to plan a coordinated upgrade of scheduler and workers before using the new redaction flags, given the silent behavior described in the documentation itself. The migration from vParquet4 to vParquet5 as the default also deserves testing in a staging environment before going to production, since it changes the storage format that underpins everything else.
Translated from the Brazilian Portuguese original · Read the original

Researchers find spyware that infects phones via ads with no click at all
Citizen Lab documented for the first time a spying campaign that uses real-time ad auctions to infect devices without any interaction from the victim.