

Why Postgres Looks Slow When the Problem Is Storage, According to a Benchmark Presented at POSETTE
A benchmark presented by Sai Srirampur at POSETTE 2026, detailed in a ClickHouse blog post, compared the same 3.3-billion-row workload on EBS and local NVMe and found a difference of up to 9.24 times in throughput.

When a PostgreSQL database starts choking in production, the common instinct is to look for the problem in the query, the index, or the database version. A benchmark presented by Sai Srirampur at the POSETTE 2026 conference and detailed in a ClickHouse blog post published in August 2026 suggests a different starting point: the storage layer.
The argument isn't new to anyone who has debugged a large database before, but the data is concrete. Running the same 3.3-billion-row workload, the same PostgreSQL configuration achieved throughput of 1,734 TPS on AWS gp3 provisioned at 3,000 IOPS and 16,030 TPS on local NVMe, a difference of 9.24 times on the same hardware, same version, same query.
The Five Symptoms That Look Like Different Problems
The talk begins by listing five symptoms that teams running Postgres at scale (hundreds of gigabytes to terabytes, with real concurrency) tend to recognize:
- Slow ingestion: pipelines with heavy
UPDATE/UPSERTtraffic that used to take seconds start taking minutes as volume grows. - Inconsistent read latency: most queries stay fast, but P95 jumps from milliseconds to seconds, and dashboards start timing out.
- Delayed autovacuum: table bloat grows from gigabytes to terabytes because
VACUUMcan't keep up with the pace ofUPDATE/UPSERT. - Slower checkpoints: an operation that used to be invisible starts competing for I/O and CPU with the client workload, becoming a recurring latency spike.
- Logical replication lag: when replicating to Kafka or ClickHouse, WAL decoding slows down and the replication slot grows.
According to the talk, these symptoms don't always share the same root cause, but they frequently share a common cause that goes unnoticed: storage performance.
How Storage Connects the Five Symptoms
As the working set outgrows the memory available to PostgreSQL and the operating system's page cache, more reads start depending on physical I/O. On slower storage, the cost and queueing of those reads increase both average latency and tail latency (P95/P99).
The central point is that client queries and background maintenance compete for the same storage budget. Heap and index writes, WAL syncing, checkpoints, VACUUM, and logical decoding spills all compete for bandwidth, IOPS, and queue capacity. When storage hits one of these limits, operations start delaying one another, and that's how a storage bottleneck can show up as five apparently separate problems.
The Benchmark Design
To isolate storage as the variable, the test used eight identical PostgreSQL clusters: four with local NVMe (instance-store) and four with baseline gp3 at 3,000 IOPS, all on m6id.4xlarge instances (16 vCPUs, 64 GiB of RAM, 16 GiB of shared_buffers). Using multiple instances per storage type served to normalize variation across runs.
The base was a 482 GiB pgbench_accounts table with 3.3 billion rows. Each cluster ran the same random UPDATE workload for five minutes, with 64 clients and 16 worker threads:
\set aid random(1, 3300000000)
UPDATE pgbench_accounts SET abalance = abalance + 1 WHERE aid = :aid;
The only variable between the two groups was the storage class.
The Numbers: Where the 37 ms of Latency Went
Beyond the 9.24x difference in throughput, median transaction latency dropped from 36.9 ms (EBS) to 4.0 ms (NVMe). On maintenance operations, NVMe completed a VACUUM over 10 GB of bloat in 366 seconds versus 964 seconds on EBS, and drained a 10 GB logical replication backlog in 139 seconds versus 238 seconds.
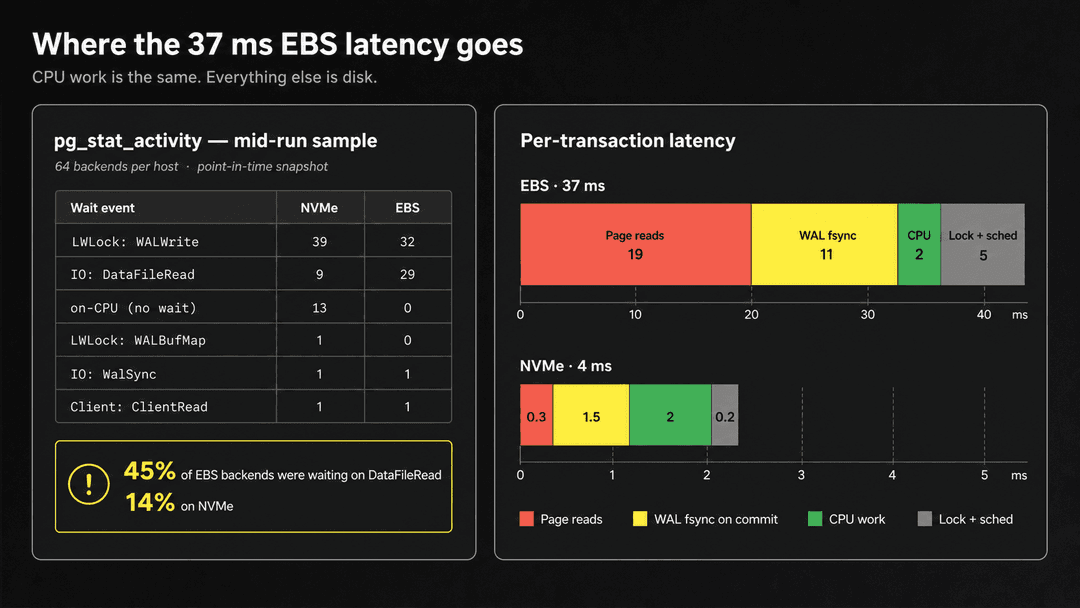
Breaking down the 37 ms of latency on EBS, the report attributes about 19 ms to page reads (versus 0.3 ms on NVMe), 11 ms to WAL fsync on commit (versus 1.5 ms), and 5 ms to lock and scheduler overhead (versus 0.2 ms). CPU time itself was practically equal in both scenarios, around 2 ms.
Most of the additional EBS latency came from waiting on storage, not from PostgreSQL doing more CPU work.
Recap of the talk by Sai Srirampur, POSETTE 2026, via ClickHouse
A snapshot of pg_stat_activity in the middle of the run reinforces the pattern: of the 64 connections, 29 on EBS were stuck on IO:DataFileRead versus 9 on NVMe (about 45% vs. 14%). The CPU profile brought a counterintuitive data point: in a window of ~240 seconds, the NVMe host accumulated 2,253 CPU-seconds (~9.4 cores busy) versus just 251 CPU-seconds on EBS (~1 core busy), meaning the process on EBS spent most of its time stalled waiting on disk, not computing.
The talk's own caveat matters: the result holds for this workload and this specific EBS configuration (gp3 baseline at 3,000 IOPS); a different IOPS provisioning would likely change the numbers.
What to Check Before Using Local NVMe in Production
Instance-store NVMe is tied to the machine's lifecycle: losing the node means losing the local copy of the data, the volume can't be snapshotted via the EBS API, and available capacity depends on the instance type chosen. The architecture proposed in the talk addresses this with three layers, and this is where the real work lies for anyone adopting the pattern:
- Synchronous quorum replication with two standbys. A configuration like
ANY 1 (standby1, standby2)lets the transaction commit as soon as either of the two standbys durably confirms the WAL, instead of waiting for the slower of the two. Distributing nodes across availability zones protects against the failure of an entire AZ. - Continuous backups to object storage. Open-source tools like WAL-G perform base physical backups and continuous WAL archiving outside the individual machines. With low-latency WAL shipping, this architecture can target an RPO measured in seconds and point-in-time recovery within the retention window.
- Capacity planning by instance type, since available NVMe space varies depending on the instance type chosen in the cloud.
Backups and archived WAL also need to live in a separate failure domain, with an additional regional copy if the recovery plan needs to survive an entire region going down. The point the talk makes is that standbys solve fast failover, while backups protect against corruption, operator error, and whole-cluster failure; they are complementary mechanisms, and both need regular testing.
Who Already Runs This in Production
The talk cites public examples: Instacart has reported using PostgreSQL on NVMe for a latency-sensitive search workload, and Datadog has described PostgreSQL instances with local NVMe for workloads demanding that profile. The recurring pattern in both cases is local storage for performance, synchronous replication for availability, and backups/WAL stored independently for recovery.
What This Changes for Those Running Postgres in Brazil
For those running managed PostgreSQL (RDS, Aurora, Cloud SQL) or self-hosted instances on Brazilian cloud infrastructure, the practical takeaway isn't "switch everything to local NVMe tomorrow." It's to use the talk's five symptoms as a diagnostic checklist before optimizing a query or changing database versions: look at pg_stat_activity for I/O waits, check whether VACUUM is keeping up with the volume of UPDATE/UPSERT, and compare provisioned IOPS with the actual read volume the working set demands.
If the team decides to migrate to instances with local storage (like the m6id instances used in the benchmark, or equivalents on other clouds), the latency gain comes bundled with the obligation to build the tedious part: synchronous quorum replication, continuous backup outside the node, and regular restore testing. It's a change in operating model, not an isolated configuration tweak, and the talk itself is explicit about that: the conclusion is narrower than the title suggests, local NVMe reduces I/O cost, but it demands this different operating model.
Translated from the Brazilian Portuguese original · Read the original
React 19.3 creates browser() API to mark client-only components
React version 19.3, released on September 9, 2026, adds the browser() API to formally declare components that should not be rendered on the server.

