How I optimized a production page's INP to pass Core Web Vitals
A real walkthrough: measuring INP with the web-vitals library and CrUX, reproducing the bottleneck in Chrome DevTools, breaking up long tasks, and validating the improvement in Search Console.

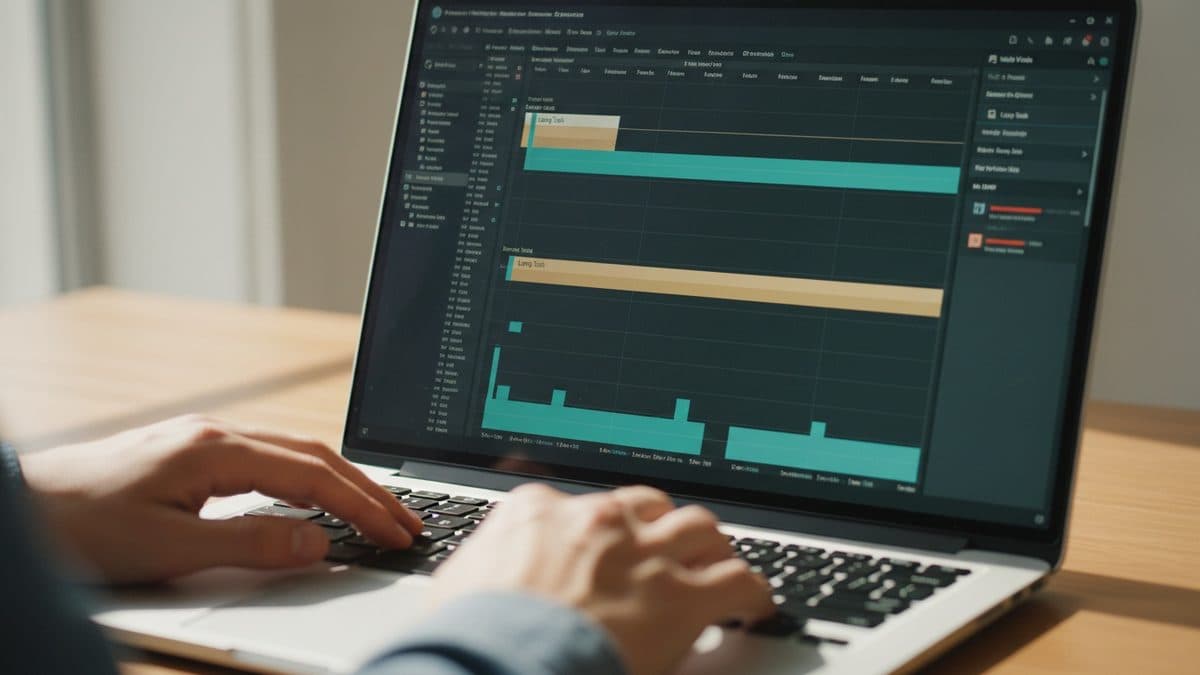
O INP (Interaction to Next Paint) has been a stable Core Web Vitals metric since 2024 and replaced the old FID. The practical difference is stark: while FID only measured the delay of the first interaction, INP observes all interactions (clicks, taps, and keystrokes) throughout the page's lifetime and reports a single value that covers the vast majority of them. According to web.dev's documentation, 90% of a user's time on a page happens after loading, so that's where responsiveness really matters.
The thresholds you need to hit, measured at the 75th percentile in the field, separated by mobile and desktop:
- Good: INP ≤ 200 ms
- Needs improvement: between 200 ms and 500 ms
- Poor: above 500 ms
A page with a 380 ms INP on mobile was the case that brought me to this tutorial. I'll show the entire path I took: measuring, reproducing, fixing, and validating.
Step 1: Measure real INP with the web-vitals library
INP is made up of three parts: input delay (time until the event handler starts running), processing duration (time spent executing the callbacks), and presentation delay (time until the next frame is painted). Measuring this by hand, respecting percentiles, the back/forward cache, and the difference between the Event Timing API and the metric itself, is laborious. That's why I used the official web-vitals library.
npm install web-vitalsWhat tripped me up at first: a raw console.log didn't tell me which interaction was slow. The library solves this with the attribution build:
import { onINP } from 'web-vitals/attribution';

onINP((metric) => {
  const attr = metric.attribution;
  navigator.sendBeacon('/rum', JSON.stringify({
    inp: metric.value,
    rating: metric.rating,
    target: attr.interactionTarget,     // element selector
    type: attr.interactionType,          // 'pointer' or 'keyboard'
    inputDelay: attr.inputDelay,
    processingDuration: attr.processingDuration,
    presentationDelay: attr.presentationDelay,
  }));
}, { reportAllChanges: false });
An important detail from the documentation: event entries below 104 ms aren't reported by default by performance observers, and INP is only finalized when the page goes to the background or is unloaded. web-vitals already listens for the visibilitychange event under the hood, so you don't lose the final value on mobile tabs that never fire unload. Let the backend calculate the p75 afterward.
While RUM data hasn't accumulated yet, you can get a quick snapshot with CrUX via PageSpeed Insights. CrUX tells you whether there's a problem (and on which device), but not what caused it. That's what confirmed my 380 ms on mobile, always on the click of a listing filter.
Step 2: Reproduce the bottleneck in Chrome DevTools
With the target in hand (the selector from the attribution data), I opened the DevTools Performance panel. The trick to faithfully reproducing INP:
- Enable CPU throttling at
4x slowdown(simulates an entry-level phone, which is where Brazil feels it most). - Start recording, perform the problematic interaction, stop the recording.
- On the Interactions track, DevTools marks the interaction and its duration. In my case, it showed up in red.
Below, on the Main track, the long tasks showed up: any task over 50 ms on the main thread, flagged with the red triangle in the corner. In my case, the click handler triggered a synchronous re-render of 300+ list items, all in a single ~290 ms task. The main thread got locked up and the browser couldn't paint the feedback frame, exactly what the web.dev video illustrates with the accordion that opens and closes on its own because the user clicks several times.
A second culprit appeared: a third-party script (an analytics tag) running within the same frame because of a global click listener. On the Main track, you can see the file's URL and the function name in the bottom-up view.
Step 3: Apply the fixes
I targeted processing duration, which was the biggest slice. Three techniques fixed it.
Yield to the main thread. Instead of processing everything at once, I broke up the task and yielded control to the browser so it could paint the feedback first:
function yieldToMain() {
  if ('scheduler' in window && 'yield' in scheduler) {
    return scheduler.yield();
  }
  return new Promise((r) => setTimeout(r, 0));
}

async function handleFilterClick(items) {
  updateButtonState();      // immediate visual feedback
  await yieldToMain();      // lets the browser paint
  await renderInChunks(items);
}
scheduler.yield() is preferable to setTimeout(0) because it doesn't send the continuation to the end of the queue (it doesn't lose its turn to other tasks). Where there's no support, the setTimeout fallback already handles the essentials.
Chunked rendering. The list started being processed in chunks of 50 items, with await yieldToMain() between them. No individual task exceeded 50 ms.
Debounce on input. There was also a search field that triggered filtering on every keystroke. A simple debounce cut the processing duration during typing:
let t;
input.addEventListener('input', (e) => {
  clearTimeout(t);
  t = setTimeout(() => filtrar(e.target.value), 150);
});
For the third-party script, I moved its initialization to after the first relevant interaction and added { passive: true } where it fit. For third parties you don't control, load them via requestIdleCallback or defer them with the facade strategy when possible.
Step 4: Validate the improvement before and after
I repeated the Performance recording with the same throttling. The 290 ms long task turned into a sequence of short tasks, and the interaction on the Interactions track dropped into the green range. In the lab, the simulated INP came out around 140 ms.
But lab doesn't replace the field. The honest cycle was:
- RUM in production: the INP p75 started dropping within the first 48 hours of traffic, measured by the
web-vitalsbeacons. - Search Console: the Core Web Vitals report consolidates CrUX data and takes ~28 days to reflect the rolling window. The URL moved from "Needs improvement" to "Good" about a month later. There's no point checking the next day: CrUX is a running 28-day average.
- PageSpeed Insights: confirms the origin data and, when there's enough volume, gives per-URL data.
What's still open
One point the documentation itself warns about, and that bit me: interactions inside iframes count toward the real INP (and toward CrUX), but the JavaScript API can't see their content. If your page has an embedded video or an iframe widget, there can be a mismatch between what your RUM shows and what CrUX reports. The way out is for the sub-frame to report its own event-timing to the parent frame, something I'm still implementing.
The engineering lesson: INP isn't fixed with a trick, it's fixed by yielding the main thread at the right time and measuring the real field p75 before and after. The lab speeds up diagnosis, but CrUX is the one that signs off on the verdict.
Translated from the Brazilian Portuguese original · Read the original

Search Console Doesn't Separate AI Overviews Clicks From Traditional Organic Search
Google Search Central's documentation confirms it: clicks from AI-generated Overviews are lumped together with traditional search in the performance report, with no dedicated filter. Here's how to measure GEO's effect anyway.