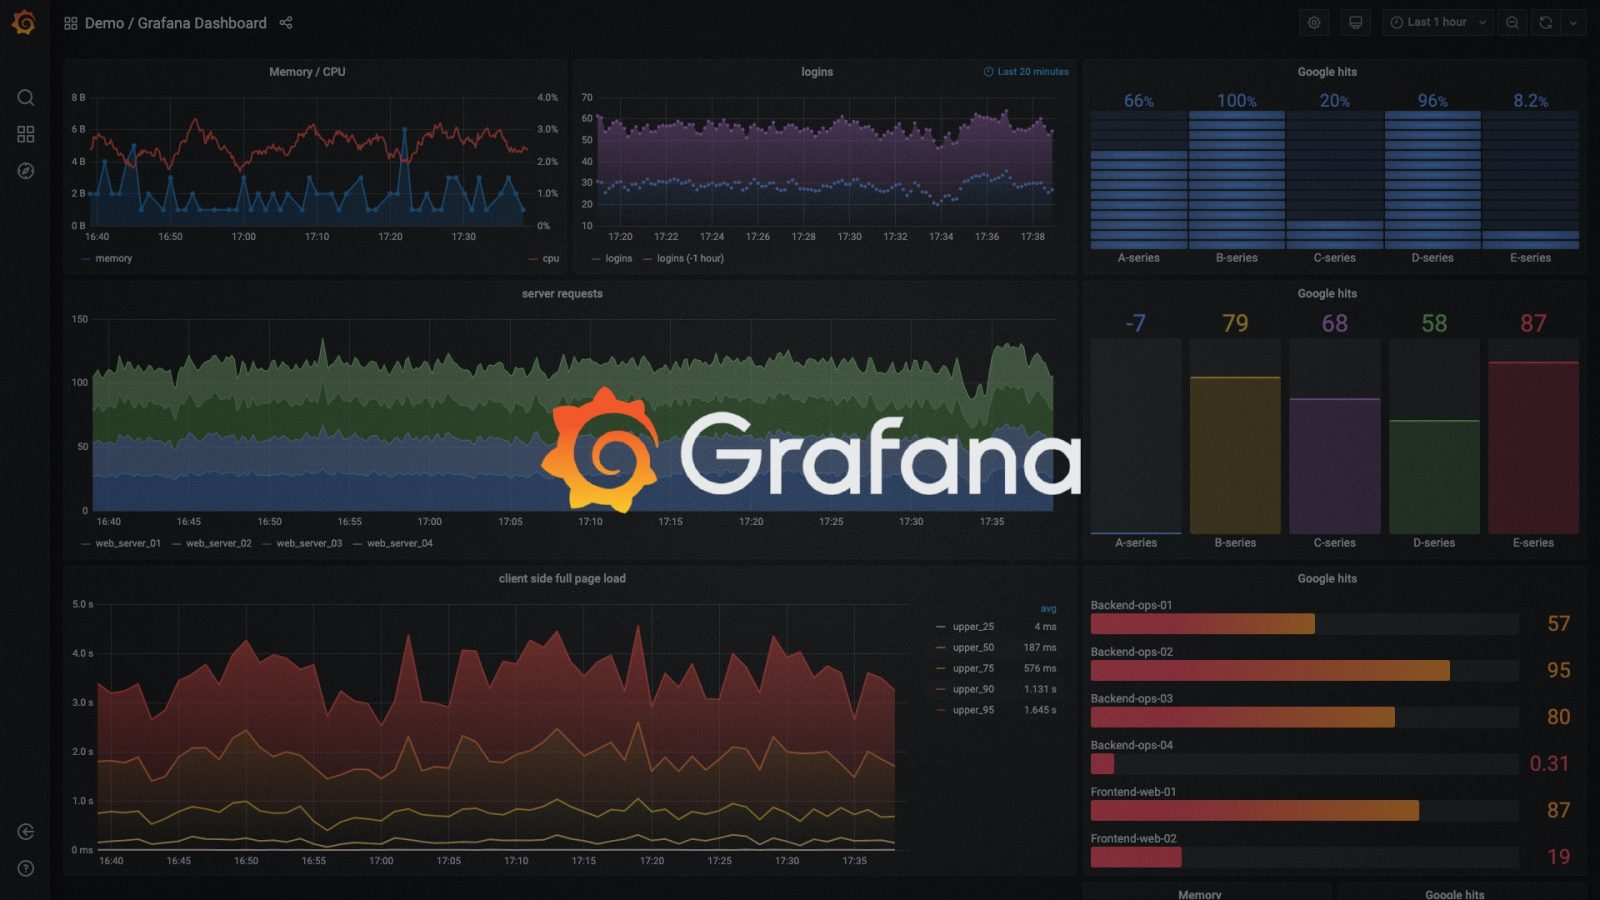
Surely you who work with application development must have heard about – or already use – Grafana, an Opensource tool that uses virtual machines to monitor websites, systems and applications. Basically, you give the solution access to connect to a company’s services and applications (including the cloud of different providers and physical data centers) to do the monitoring, providing real-time metrics that help developers and companies to have, in real time , visibility of your business.
With this resource, it is possible, for example, to understand the behavior of the website user, or how long he waits for a payment to be approved. The solution is also widely used by application developers to find out, for example, if it is taking longer than usual to respond to user commands. With this information in hand, the developer can make improvements so that the application or website works as expected.
The big Achilles heel of Grafana, however, is that it uses virtual machines (sometimes more than one) to do this monitoring, increasing the hardware load. Another disadvantage is that if the monitoring fails, for some reason, you no longer have access to this information, which can be crucial for the company’s business.
But there are other tools that can facilitate this process and offer advantages in relation to the challenges mentioned above, such as the case of Azure Managed Grafana, which has just been generally available for those who use Microsoft Azure – with the advantage that it can also be used in clouds from other vendors, all in real time.
With the service fully managed, the tool allows deploying Grafana with specific permissions for each area to access certain information, in addition to granting permission for what will be read or written without having to deal with managing multiple user identity groups. These tools also offer high availability without having to provision servers, configure and update software, or do the heavy lifting involved in securing and scaling the tool. And the best: without using virtual machines or the capacity of your software, which frees up space for other activities.
One of the numerous advantages is that you can share the solution panels with people inside and outside your organization, in addition to allowing other people to participate in order to monitor or solve any problems – all remotely and in real time, making that you have the data monitored much more securely and without the risk of being lost due to a system crash.
If you or the company you work for need a solution that is capable of graphically representing process data from Internet of Things devices, for example, with the addition of this management it will be simpler to accomplish, since it will be possible to track all the company’s operations and create alerts when a certain goal is not achieved, providing valuable insights for the company.
This novelty is fundamental and helps developers to be able to help companies to have more visibility, in real time, of applications or services on the Internet. In addition, it is essential to obtain the possibility of Grafana running in one or more clouds, since the concept of multicloud advances exponentially and presents several benefits. With these facilities, an online retail store, for example, can correct errors and improve access to applications or services – which will certainly help it to get more customers or offer a better experience and retain the loyalty of those it already has. consume the product or service, an important differential in a competitive market like the current one.
















Leave a comment