Hey guys!
Some applications, mainly those that work with financial data, sales, etc., often need to display graphs.
There is a simple way to display multiple charts in Xamarin.Forms, with the amazing Microcharts control!
We’ll see how to use this control and the graphics possibilities.
Let’s go!
Configuring the Control
Let’s go to nuget and download the Microcharts and Microcharts.Forms packages. Yes, let’s install version 0.8.5-pre, as it fixes several bugs in the current version – including the one I’m using in production:
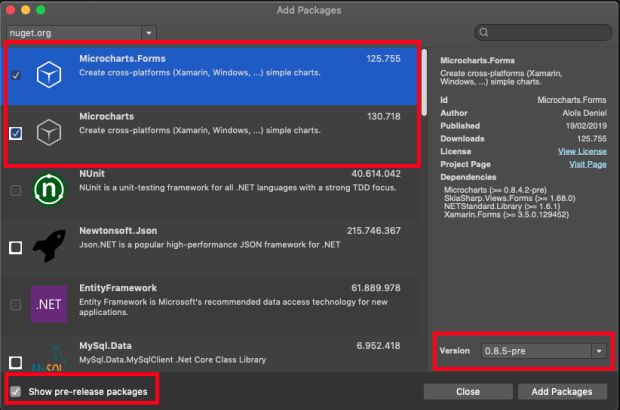
Install in all projects, and that’s it.
Using Microcharts
There are several types of charts in Microcharts:

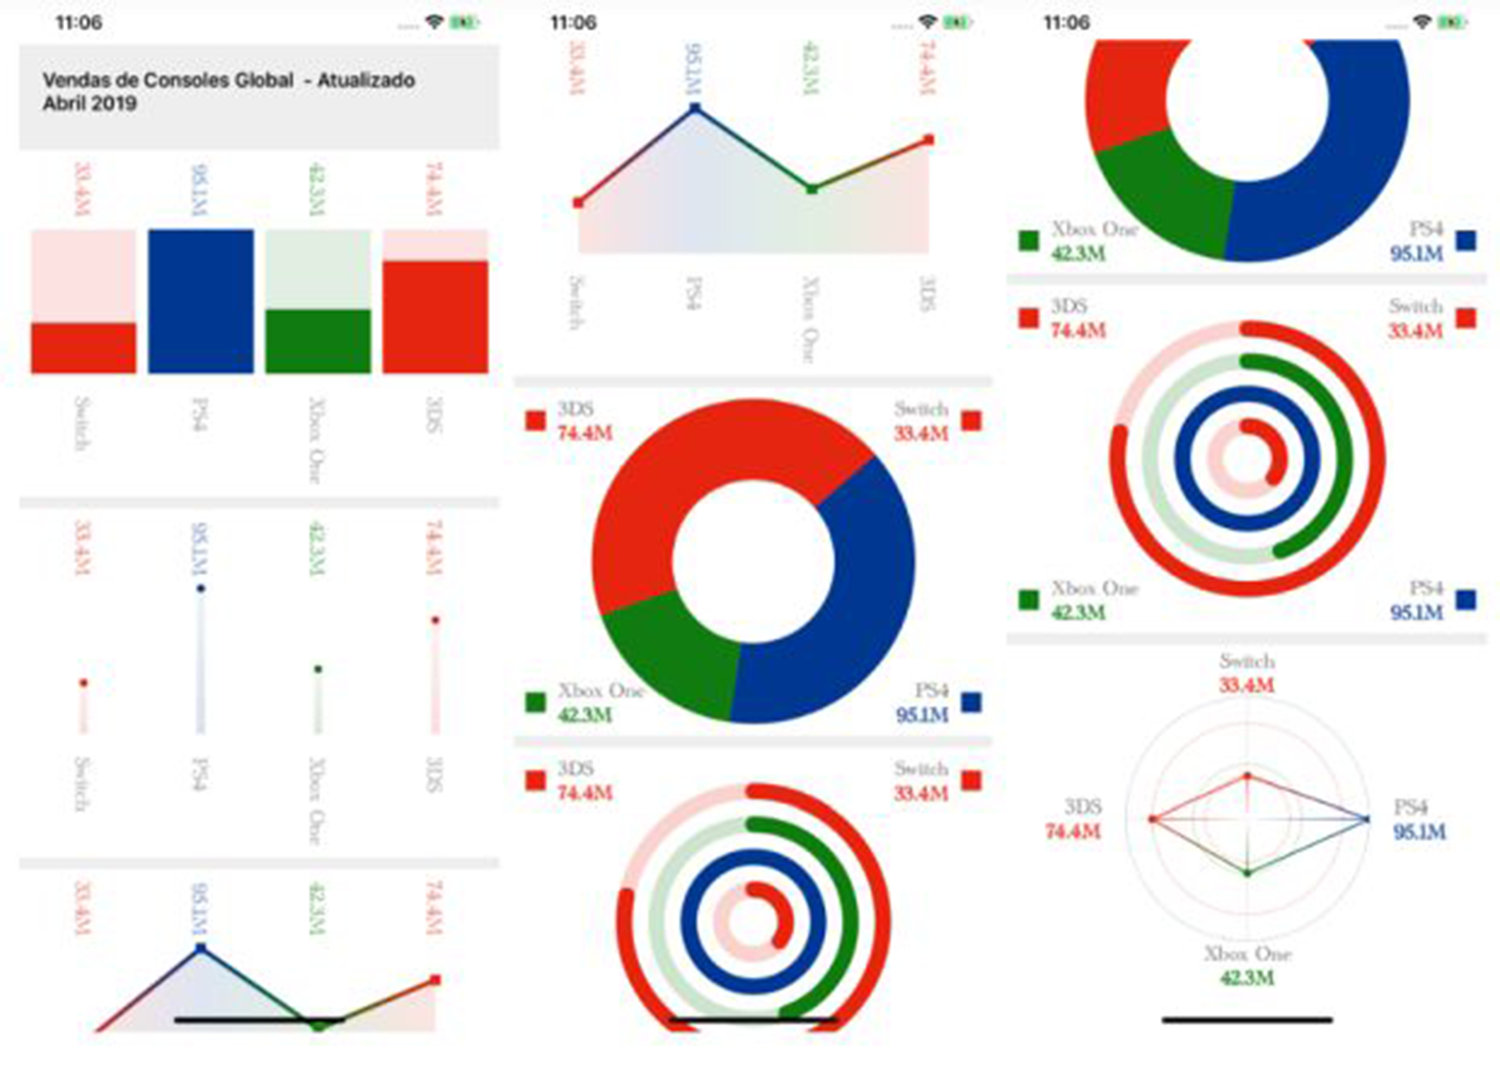
To give an implementation example, let’s create a global ranking of consoles sold – last updated in April 2019.
To use Microcharts on the screen, we will use the namespace xmlns:microcharts=”clr-namespace:Microcharts.Forms;assembly=Microcharts.Forms” and create six types of charts to demonstrate the variations:

Now let’s implement the logic to create the charts:

The ChartEntry is responsible for being the object to generate each separate chart data. In it, we can define the value, graphic color, text color, and displayed text.
Chart is the type of chart that will be displayed on the screen. In the example, I implemented the six types to show the difference between them. Each graph has its customization properties, making the control very flexible.
Let’s run:

Pretty cool and simple, isn’t it?
If you want to download the code used in the example, access this link.
Hope this helps.
All the best!
*The content of this article is the author’s responsibility and does not necessarily reflect the opinion of iMasters.













Leave a comment